Global warming reaches 1°C above preindustrial, warmest in more than 11,000 years
Authors
Climate Analytics
Share

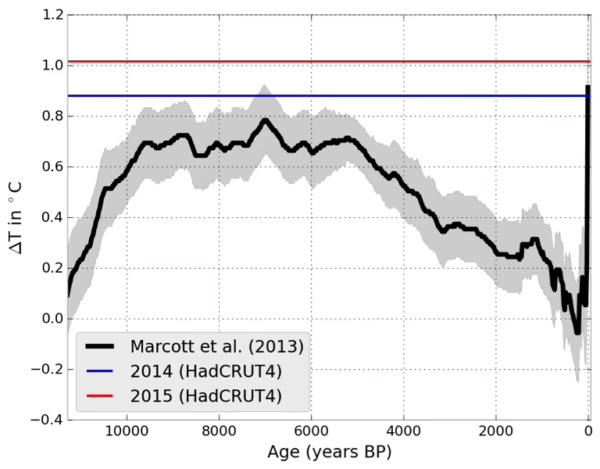
Over the first nine months of 2015, global mean warming reached 1°C above preindustrial for the first time, as reported by scientists from the Met Office and the Climate Research Unit at the University of East Anglia.
2015 is likely to become the warmest year in more than 11,000 years (see Figure 1). This signals a departure from the mild climate of the last 10,000 years in which agriculture and human civilisations have developed and thrived.
Given the lack of action in reducing emissions over the last decade, crossing 1°C warming is an inevitable, yet highly concerning event. It is a signal from the climate system that time is running out if we are to be able to reduce emissions fast enough to hold warming below 2°C and below 1.5°C by 2100.
Examples of climate impacts under a warming of 1°C experienced in 2015 include:
- The third ever global coral bleaching event. Higher ocean temperatures, combined with ocean acidification, threaten coral reefs all over the world. A record El-Niño has intensified this bleaching event, and preliminary model projections indicate it’s likely to last well into 2016.
- Record heat waves in India and Pakistan. The heat wave that hit India in May this year caused more than 2500 deaths, making it the fifth deadliest heat wave in history according to the Emergency Events Database EM-DAT. During this heat wave, and the following (but separate) heat wave that hit Pakistan in June (with about 2000 people dead), recorded temperatures were as high as 44-49°C.
- A key part of the West Antarctica’s ice sheet, the Amundsen Sea region, has most likely been destabilised due to warming to date, and a recent modelling study indicates that this could destabilise the entire Western Antarctic, with resulting sea level rise of more than three metres over the next centuries.
These observations add further support to one of the key messages of the UNFCCC Structured Expert Dialogue (SED) Report on the adequacy of the 2°C limit that:
Significant climate impacts are already occurring at the current level of global warming and additional magnitudes of warming will only increase the risk of severe, pervasive and irreversible impacts (See our Hot Topic and briefing note on further details on the outcomes of this report.)
While the technical and economic feasibility of holding below 2°C and limiting warming below 1.5°C by 2100 is not affected by crossing the 1°C level (see our briefing note on the feasibility of 2°C and 1.5°C), with each year’s delay in reducing global emissions, this task will get more difficult, and more costly.
The emission reduction commitments (INDCs) governments have put forward for COP21 in Paris, even if fully implemented, would put the world on track for a warming of 2.7°C (see Climate Action Tracker assessment).
Links to useful resources on this issue:
Hadley Centre temperature data
Blog on records in 2015
More global temperature data and figures:
NASA GISS Surface Temperature Analysis
Columbia University Global Temperature Maps
Columbia University Global Temperature — More Figures