A stress test for coal in Europe under the Paris Agreement
Authors
Marcia Rocha, Niklas Roming, Paola Yanguas Parra, Andrzej Ancygier, Fabio Sferra, Ugur Ural, Michiel Schaeffer, Bill Hare
Share
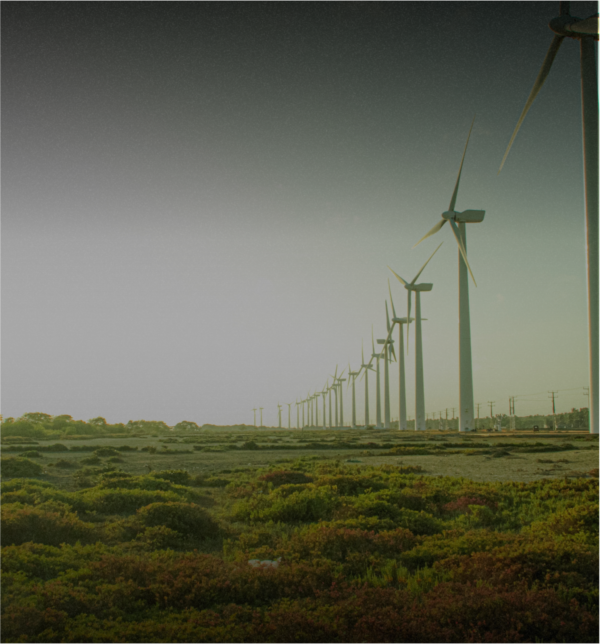
While moving away from coal is required to achieve the transformation in line with the Paris Agreement long-term temperature goal, a fast coal phase-out strategy in the European Union represents not only a necessity but also an opportunity when considering other policy goals beyond climate change. There are numerous alternatives to coal and their development is gaining momentum, many bringing benefits beyond emissions reductions, such as cleaner air, energy security, and distribution.
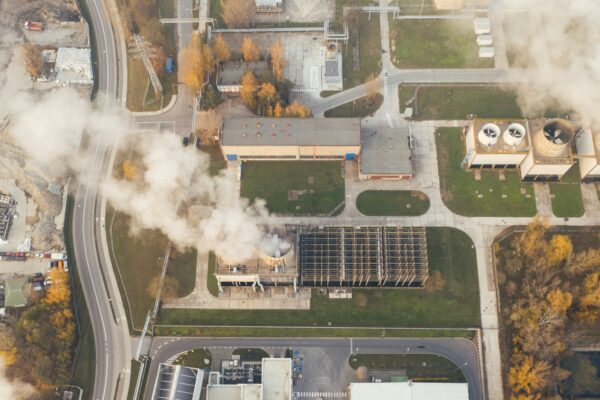
Currently hard coal and lignite jointly provide over a quarter of electricity generated in the EU. While the EU has achieved significant reductions in coal use for other purposes in the last decades, reductions in the use of coal in power plants were more modest at 11% below 2000 levels in 2014. However, the importance of these fuels varies significantly across the member states. Just two states - Germany and Poland - are jointly responsible for 51% of the EU’s installed capacity and 54% of the emissions from the coal-fired power plants but seven others have no coal-fired power plants in their electricity mix.
To stay within the Paris Agreement temperature limit, a quarter of the coal-fired power plants already operating in the EU would need to be switched off before 2020; a further 47% should go offline by 2025. If the EU is to meet its commitments under the Paris Agreement, any investments in new plants and most investments in existing power plants will not be recovered by investors.
The task ahead
Continued use of coal for power generation is not compatible with sharply reducing emissions and the EU needs to develop a strategy to phase out coal at a faster rate than it is currently doing. According to modelling completed by Climate Analytics, the EU will exceed its Paris Agreement-compatible emissions budget for coal based electricity generation by 85% in 2050 if all existing coal-fired power plants continue operating to the end of their full life span. If currently announced and planned plants are built in the coming years, this number will rise to almost 100%.
For the EU to remain within its carbon budget, member states must first shelve plans for any additional coal-fired generating capacity and secondly, must start actively shutting down currently operating units at an increased rate. Analysis suggests 25% of currently operating coal-fired power units need to be shut down by 2020, rising to 72% by 2025, before a complete shutdown by 2030.
Developing a coal exit strategy
Climate Analytics developed a methodology to determine a phase-out schedule for coal power plants in the European Union. The critical question is: which criteria should determine when individual units are switched off? From an Earth’s atmosphere perspective, this choice is irrelevant as long as emissions are being reduced at the pace required. However, from the view of the policy makers, plant owners and other stakeholders, this is a decisive point.
The report suggests two possible strategies for how the EU could achieve a complete phase-out of coal use in electricity generation, proposing a shutdown date for each coal-fired power generating units.
Both methods evaluate units on emissions performance and profit generation potential. The first approach, a so-called Regulators Perspective, prioritises shutting down the most carbon intensive plants first, where as the second approach, the Market Perspective, prioritises shutting down the least valuable plants in terms of revenue generation potential.
Translations of the executive summary


Top 20 power plant comparison
Below are the top 20 coal-fired power plants (as of July 2016) by generation capacity and their respective shut down year based on business as usual (BAU), and Paris Agreement compatible Regulator and Market strategies.
| Power Plant Details | Final Year of Operation | ||||
|---|---|---|---|---|---|
| Name | Country | Capacity | BAU | Regulator | Market |
| Bełchatów | Poland | 4928 MW | 2055 | 2027 | 2027 |
| Neurath | Germany | 4424 MW | 2055 | 2029 | 2030 |
| Kozienice | Poland | 3915 MW | 2061 | 2028 | 2025 |
| Niederaussem | Germany | 3676 MW | 2045 | 2028 | 2030 |
| Opole | Poland | 3280 MW | 2063 | 2029 | 2025 |
| Jänschwalde | Germany | 3210 MW | 2028 | 2024 | 2027 |
| Drax | UK | 2640 MW | 2025 | 2025 | 2025 |
| Brindisi Sud | Italy | 2640 MW | 2044 | 2028 | 2028 |
| Boxberg | Germany | 2427 MW | 2055 | 2029 | 2030 |
| Jaworzno-3 | Poland | 2255 MW | 2063 | 2028 | 2025 |
| Mannheim | Germany | 2147 MW | 2058 | 2031 | 2030 |
| Fiddler’s Ferry | UK | 2000 MW | 2017 | 2017 | 2017 |
| Cottam | UK | 2000 MW | 2025 | 2025 | 2025 |
| Ratcliffe | UK | 2000 MW | 2025 | 2025 | 2025 |
| Torrevaldaliga Nord | Italy | 1980 MW | 2061 | 2030 | 2029 |
| Weisweiler | Germany | 1958 MW | 2021 | 2021 | 2021 |
| West Burton | UK | 1924 MW | 2025 | 2025 | 2025 |
| Lippendorf | Germany | 1866 MW | 2043 | 2027 | 2029 |
| Turów | Poland | 1765 MW | 2063 | 2028 | 2024 |
| Moorburg | Germany | 1730 MW | 2058 | 2031 | 2029 |
(1) Note: many “plants” are on the same “site” or in the same “complex.” Sometimes they are considered different plants – sometimes with different owners – and in other cases they are considered the same plant. Financial ownership shifts all the time and, with this, the number of “plants” may also change. Our estimate is 315. This analysis is based on the number of actual units: 738 (operating and under construction).