Why action on surging methane emissions this decade is key for 1.5°C


Methane is a highly potent but short-lived greenhouse gas, and its emissions are rising globally and across all sectors. Taking strong action this decade, especially in the energy sector, is necessary to deliver rapid climate benefits and keep the 1.5°C Paris Agreement goal within reach.
Share
Faster action on methane – a highly potent but short-lived greenhouse gas – is one of the most powerful climate levers we can pull this decade to keep the 1.5°C Paris Agreement goal within reach. Achieving the necessary methane emissions reductions will require cuts across all sectors, especially in the energy sector, where curbing fossil fuel use could deliver about 60% of the total methane reductions needed by 2030. Yet methane emissions continue to rise. We examine which countries and sectors are emitting the most, shed light on where current trends are heading, and highlight the urgent need to shift course to keep the door open to 1.5°C.
Methane emissions continue to rise globally and across all sectors
Our new assessment of global, sectoral, and national trends in methane emissions across three bottom-up datasets – PRIMAP, EDGAR, and CEDS – shows that, despite differing totals due to varying methodologies, scopes, and assumptions, all datasets converge on the same conclusion: global methane emissions are rising steadily and in all major sectors, as depicted below.
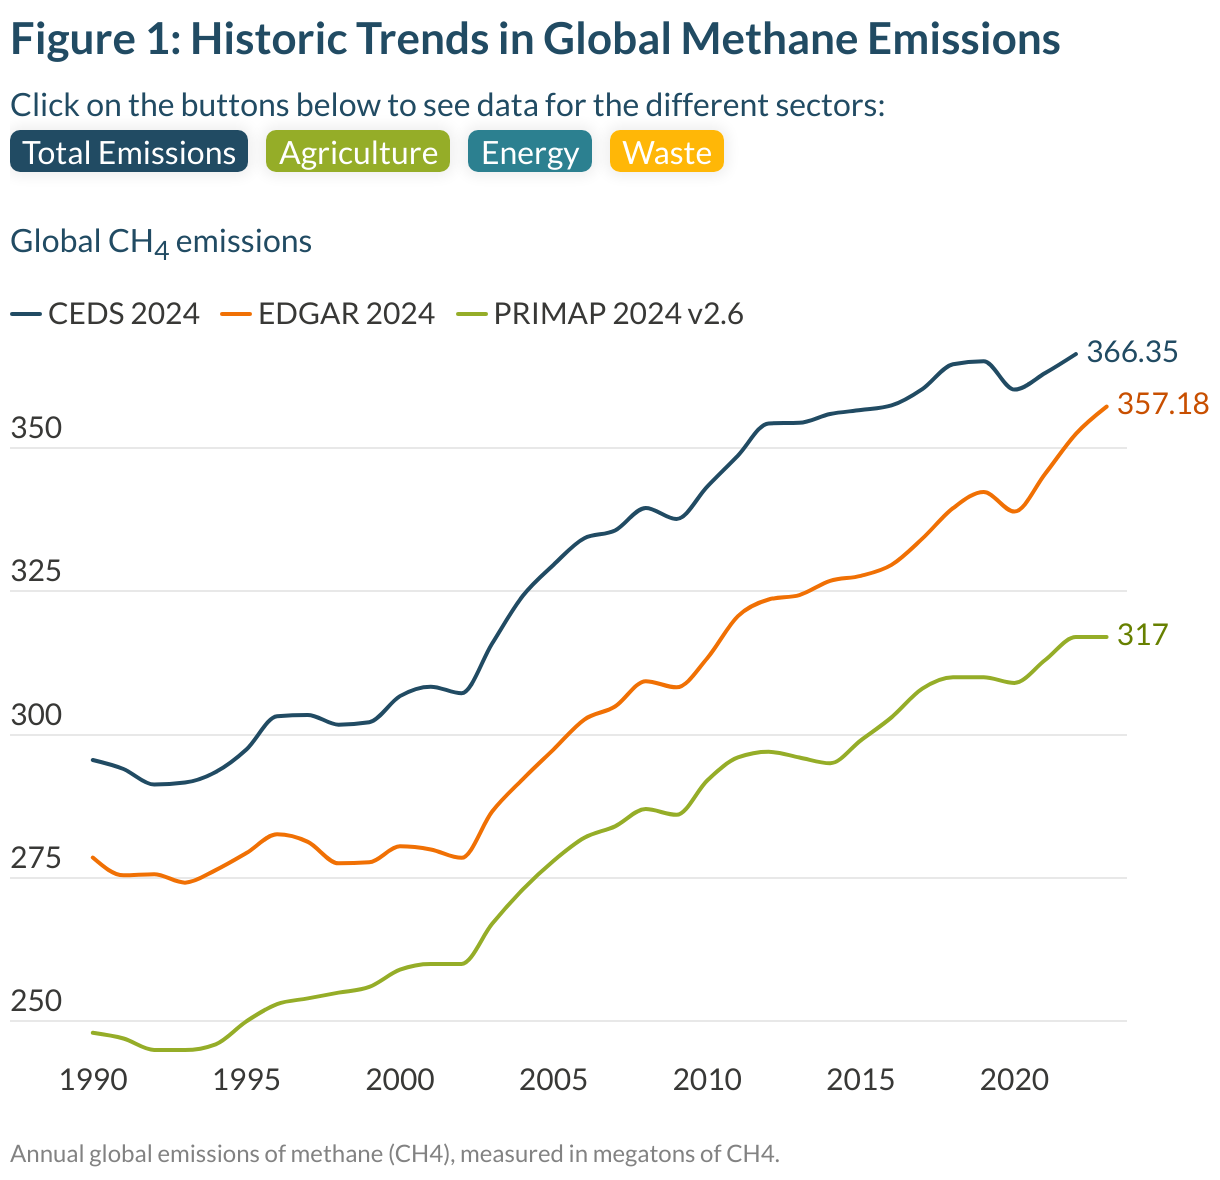
From 1990 and 2022, the world produced an ever-increasing amount of methane, with average emissions across our three datasets jumping by 26%, from 274 MtCH₄ to 345 MtCH₄.
The agriculture sector remains the biggest source of human-caused methane, responsible for 44% of global emissions in 2022. Emissions have increased from an average of 127 MtCH₄ in 1990 to 150 MtCH₄ by 2022 (18% increase), driven primarily by expanding livestock and rice production to meet rising demand. The energy sector follows closely. Methane emissions from coal, oil, and gas grew from 103 to 126 MtCH₄ over the same period (22% increase), reflecting the continued expansion of fossil fuel use.
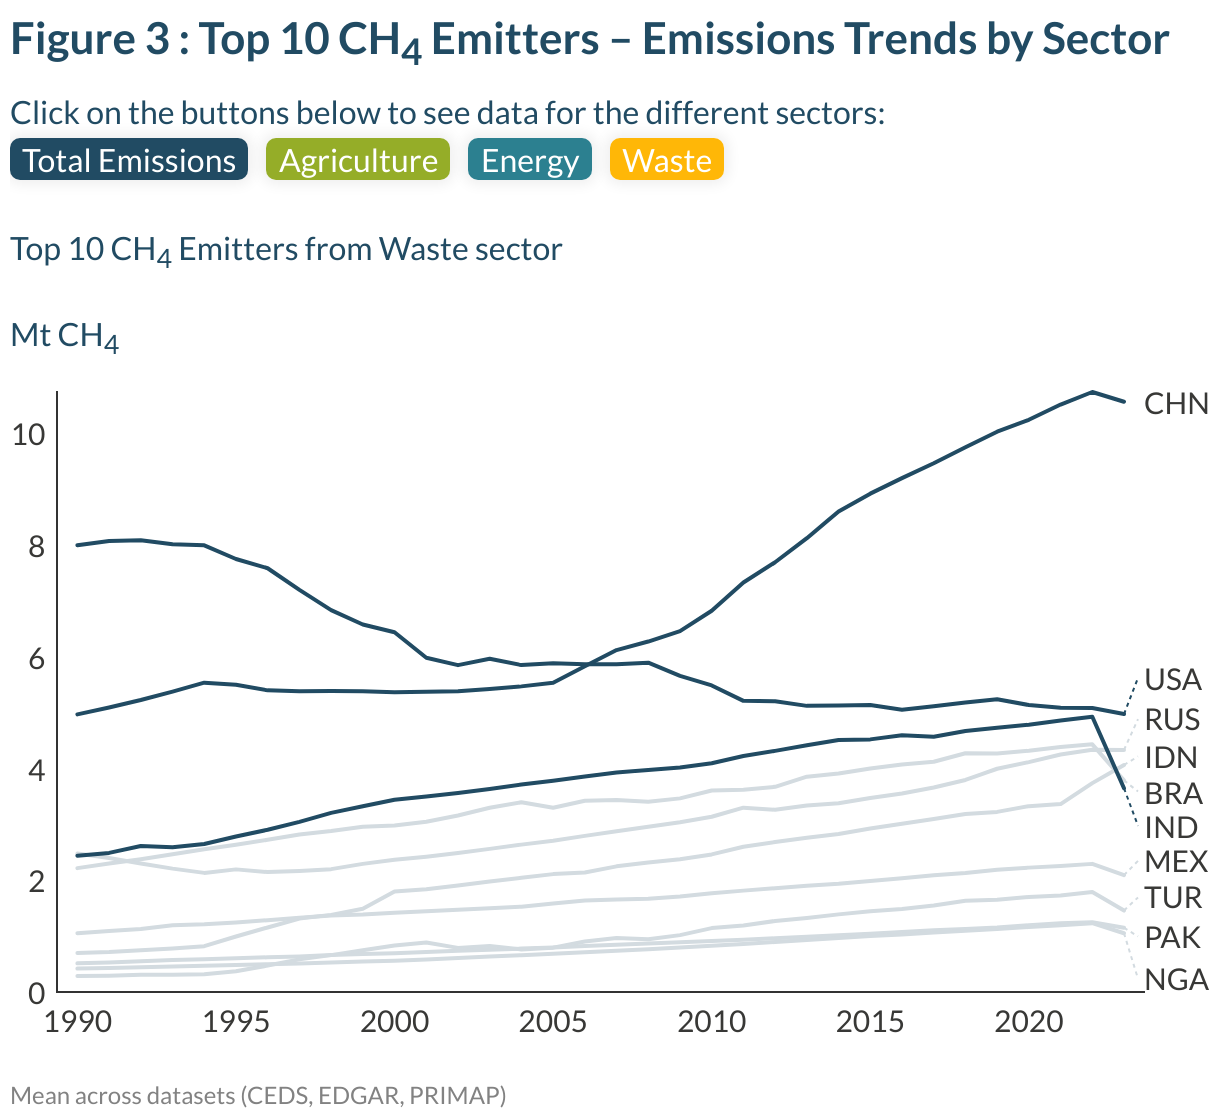
Perhaps most surprisingly, the waste sector has seen the most dramatic change, with methane emissions rising by over 50% since 1990. Notably, between 2019 and 2022, waste increased by 4.8% and was responsible for 70% of the total growth in global methane emissions during this period. Continuing urbanisation, rising consumption, and inadequate waste management are contributors to this trend.
Who’s emitting the most methane?
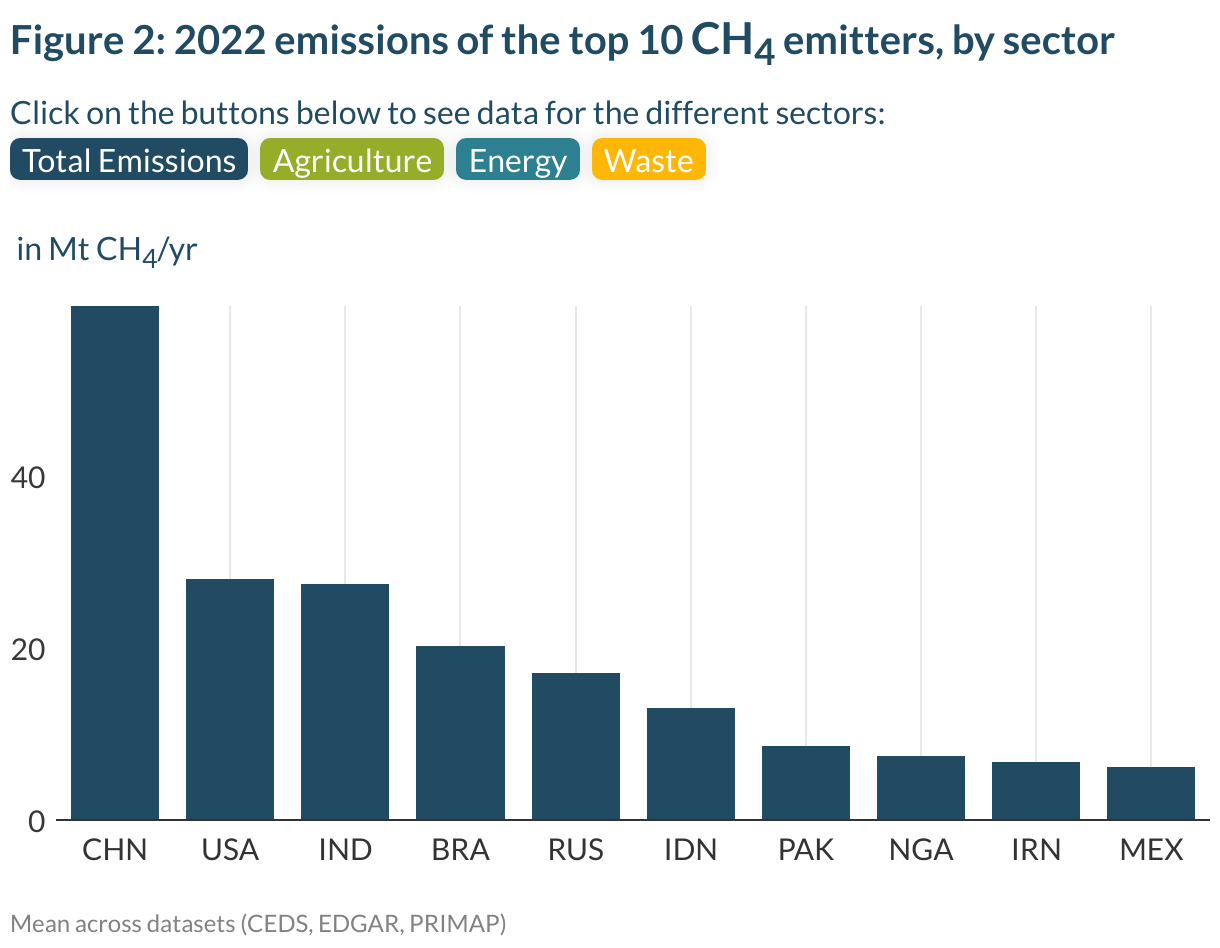
China leads the world in methane emissions, releasing an average of 60 MtCH₄ across the three datasets in 2022. The United States (28 MtCH₄,) and India (27 MtCH₄) follow with these three countries accounting for 33% of global methane emissions.
Across all three sectors, China is top methane emitter across the board. In energy, it emitted 28 MtCH₄, primarily from coal mining, while the US (13 MtCH₄,) and Russia (11 MtCH₄) trail behind, mostly due to their extensive oil and gas operations. For agriculture, China tops the list again, with 20 MtCH₄, followed closely by India with 18 MtCH₄, from cultivating rice and keeping livestock. Brazil comes in third with 15 MtCH₄, primarily from its large cattle industry. Waste-related methane is similarly concentrated, with China responsible for 17% of all global waste-related methane in 2022 followed by the United States, India, Brazil, and Russia. Toggle the buttons in chart below for a visual representation of these sectoral differences.
While these charts capture methane emissions in 2022, trends among major emitters over time reveal important differences in how emissions are evolving around the world (below). China’s total methane emissions have surged by 90% (26 Mt) since 1990, primarily due to increasingly heavy fossil fuel use. India and Brazil have also seen substantial increases – 25% and 60%, respectively – driven mainly by agricultural expansion. The steepest increases, however, have occurred in Indonesia and Pakistan, where emissions have risen by 100% and 135% respectively, mainly due to rising population and food demand, increasing emissions in all sectors. In contrast, the United States reduced its methane emissions by 9% since 1990, however recent reversals on methane regulations by the Trump administration are will likely undermine this progress.
Off track: Methane emissions and a 2.7°C world
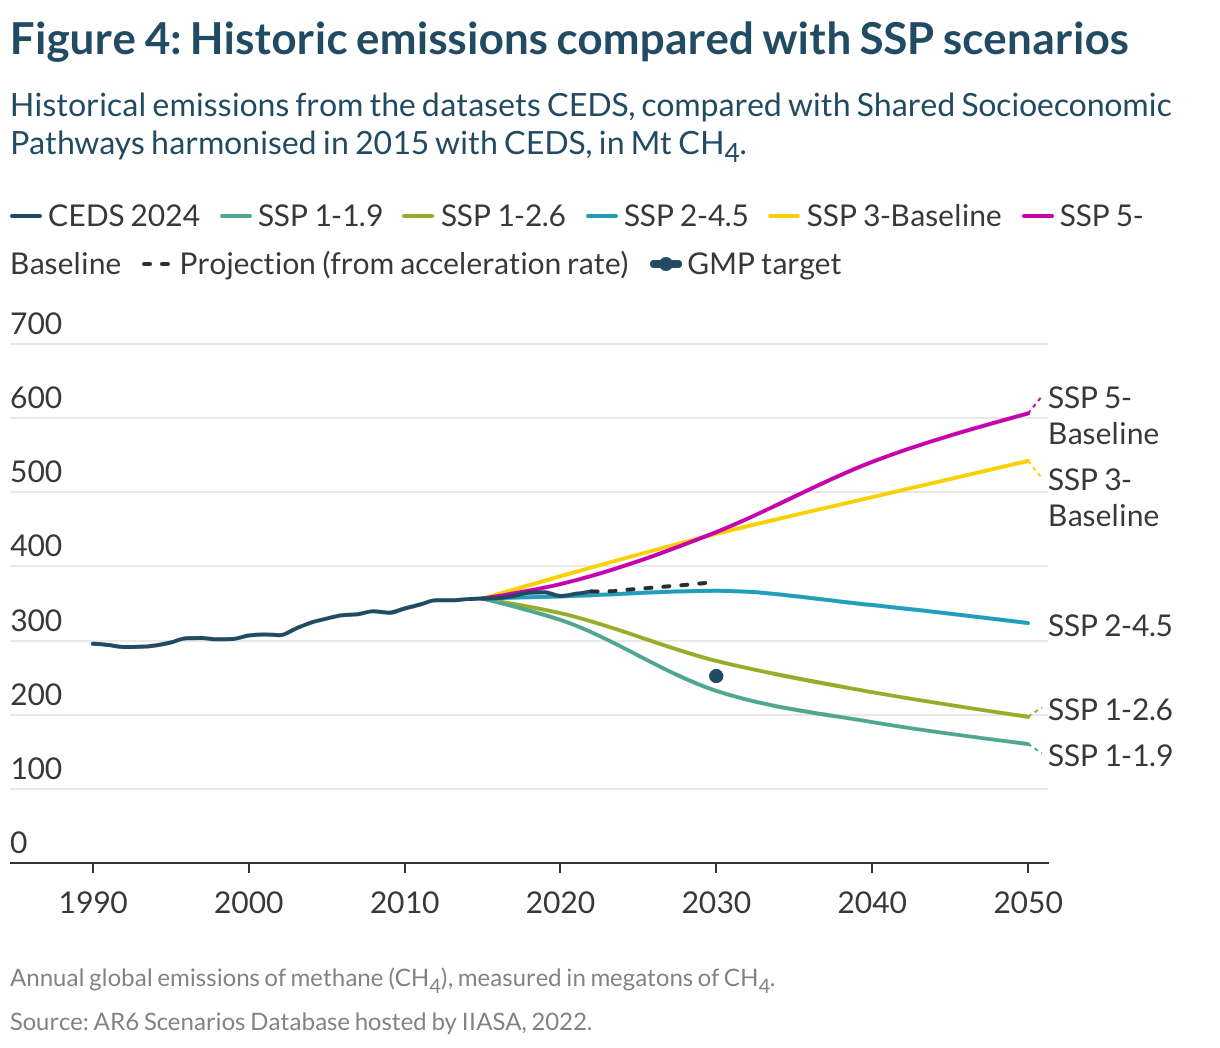
Keeping the 1.5°C goal with reach requires a sharp course correction downwards across all sectors and gases. According to IPCC AR6 projections, global methane emissions must decrease by 34% below 2019 levels by 2030 and net-zero GHG emissions have to be achieved by 2070 to keep the 1.5°C temperature limit of the Paris Agreement within reach.
The Global Methane Pledge sets a target of a collective 30% reduction in methane emissions from 2020 levels by 2030. Our analysis, however, finds that if emissions continue on the same trajectory as the past decade, methane emissions will be 6% higher in 2030 than 2020. Comparing this trend with the methane trajectories from the IPCC Shared Socioeconomic Pathways shows that historical emissions are closely following the SSP2-4.5 pathway, which results in around 2.7°C of warming by the end of the century (Figure 4).
Achieving both the Pledge and the 1.5°C goal demands bold, immediate action across all major methane-emitting sectors. Any delay will result in escalating climate impacts and further close the window to limit warming to 1.5°C above pre-industrial levels.
Implications of uncertainty in methane emissions
Methane emissions data remain plagued by significant uncertainties due to differences in measurement methods, data quality, emission factors, and sector-specific approaches. These uncertainties have serious implications.
Reliable data are foundational for policy design, implementation and evaluation. Economic instruments and methane pricing schemes, for example, depend on accurate emissions data to set prices, allocate allowances, and monitor compliance. Inaccurate inventories risk misdirecting resources or allowing major emitters to escape accountability.
Uncertainty also affects Integrated Assessment Models (IAMs). Underestimating past methane emissions can result in models prescribing insufficient mitigation actions to meet climate targets.
Accelerating methane action for 1.5°C
Without substantial reductions in global emissions this decade, sustained and high overshoot of the 1.5°C limit will become inevitable. Overshoot is highly dangerous and heightens the risk of crossing climate tipping points with irreversible impacts. As methane is 28 times more potent than CO2 in the near-term and stays in the atmosphere for much shorter periods, immediate action on methane could have a significant effect on the rate of warming – and relatively quickly.
To align with 1.5°C-compatible pathways from the IPCC’s Sixth Assessment Report, global methane emissions must fall by 34% by 2030 and 45% by 2035, compared to 2019 levels. Achieving this will require especially steep reductions in the energy sector (65% by 2030 and 75% by 2035), as well as significant cuts in the waste sector (46% by 2030 and 59% by 2035), and more modest reductions in agriculture (12% by 2030 and 13% by 2035).
While it demonstrates some collective political will, the endorsement of the Global Methane Pledge by 159 countries is still insufficient to keep global emission levels 1.5°C-aligned. The GMP’s collective target should be seen as an ambition floor, not a ceiling. However, more countries are translating these commitments into actual policies, with an increasing number setting explicit methane reduction targets and implementing new regulations to drive down emissions.
Maintaining and increasing this momentum is critical. Countries must rapidly scale up mitigation efforts across all sectors, improve emissions measurement, monitoring and reporting, and close the implementation gap. Methane mitigation is not just a necessity – it’s one of the most cost-effective and impactful tools we have to keep the 1.5°C temperature limit goal within reach.
Global Methane Explorer
Check out our comprehensive dashboard for methane emissions, targets and policies