Tools
Explore our open access tools for policymakers and researchers working on climate impacts and action.

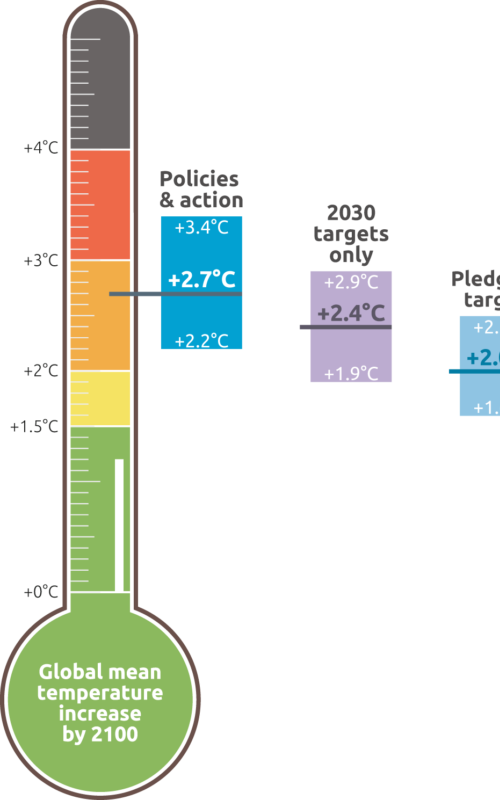
The Climate Action Tracker is an independent scientific analysis that tracks government climate action and measures it against the globally agreed Paris Agreement aim of "holding warming well below 2°C, and pursuing efforts to limit warming to 1.5°C".
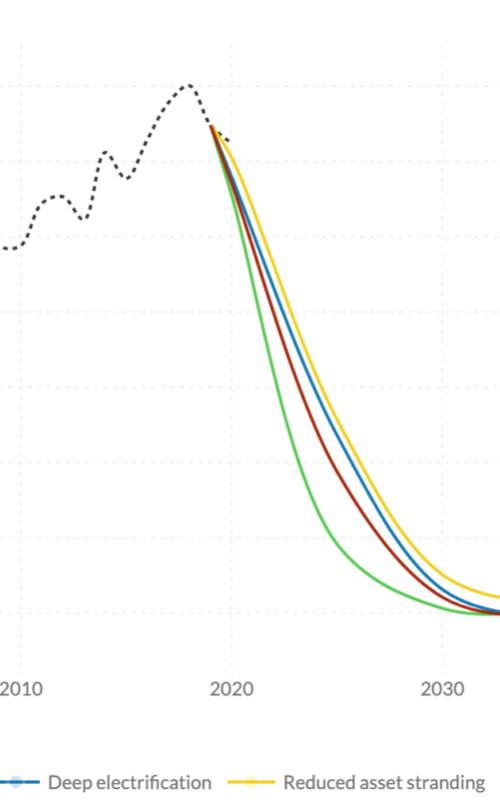
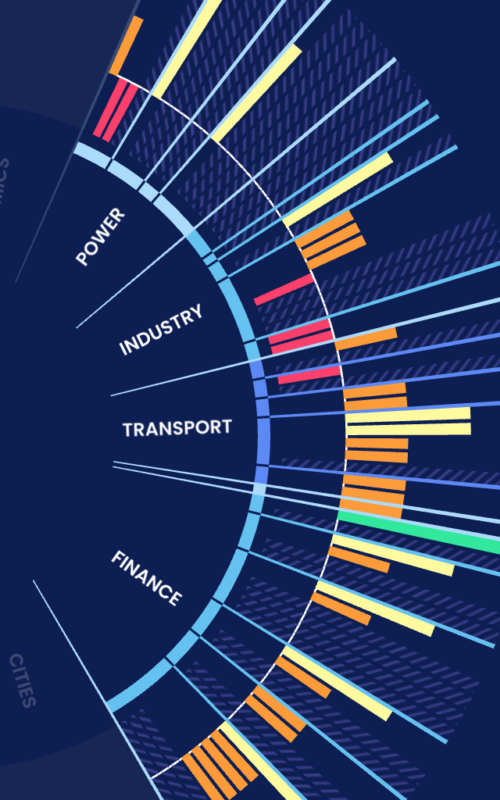
Explore 1.5°C national pathways for countries and sector-specific decarbonisation benchmarks derived from global IPCC pathways compatible with the Paris Agreement.
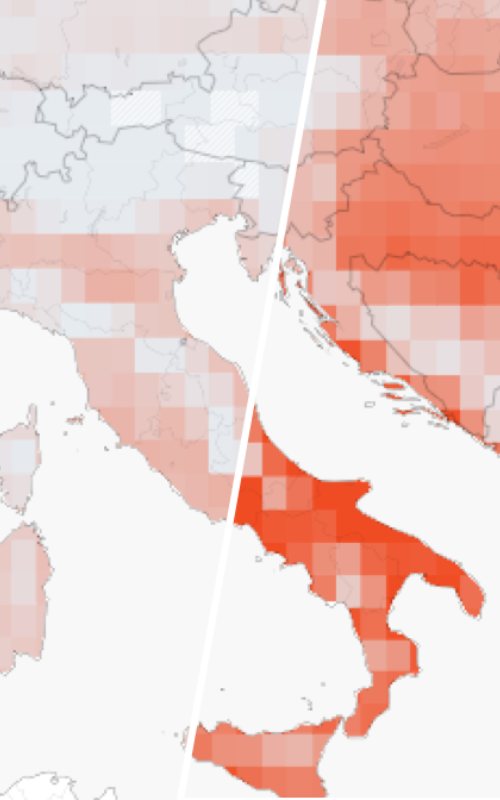
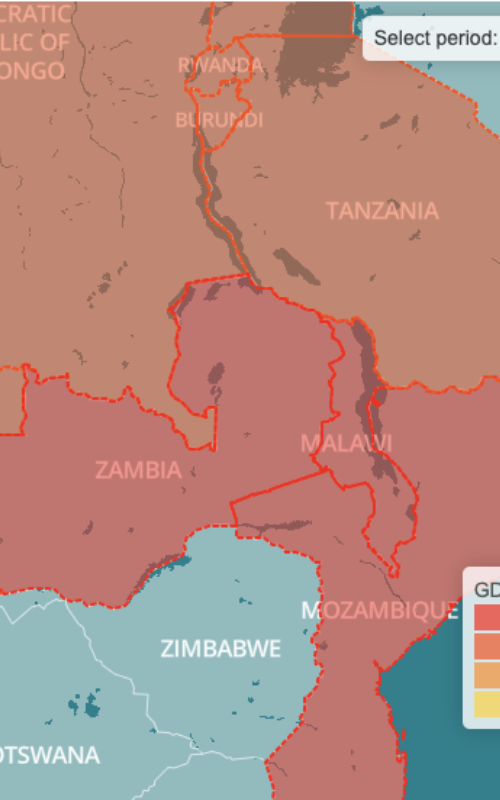
This tool shows how the severity of climate change impacts will increase over time in regions, countries and provinces at different levels of warming, starting with 1.5°C, the limit in the Paris Agreement. It also allows access to the underlying data.

This platform tracks national methane emissions, targets, and policies for countries responsible for 90% of this greenhouse gas. By providing accessible, up-to-date data and analysis, it enables users to monitor progress, identify gaps, and support urgent, evidence-based action to accelerate methane mitigation worldwide.
The Global Mitigation Potential Atlas, currently in proof of concept phase, shows where significant and potentially transformative opportunities for reducing emissions are located and aims to foster domestic action, international collaboration and learning.

The ForestNavigator Data Explorer visualises harmonised, spatially explicit datasets, including forest status, changes and disturbances, and biodiversity. Developed as part of the EU Horizon Europe project ForestNavigator, users can navigate interactive maps and charts of EU forest indicators, exploring patterns across countries and administrative units.
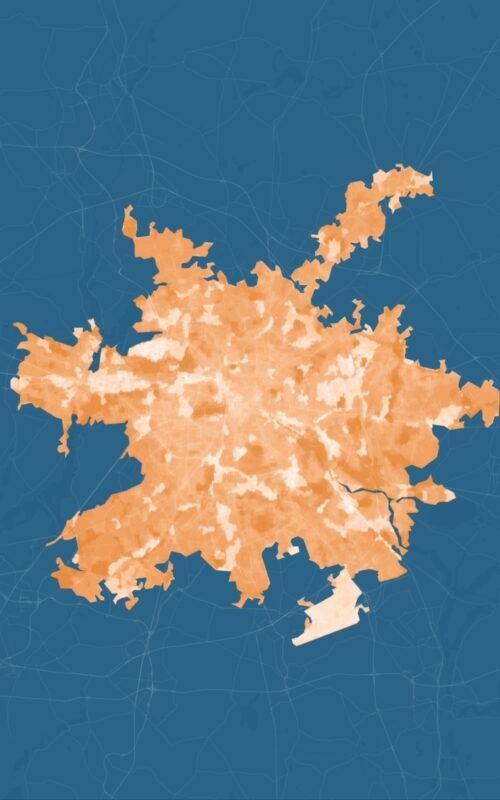
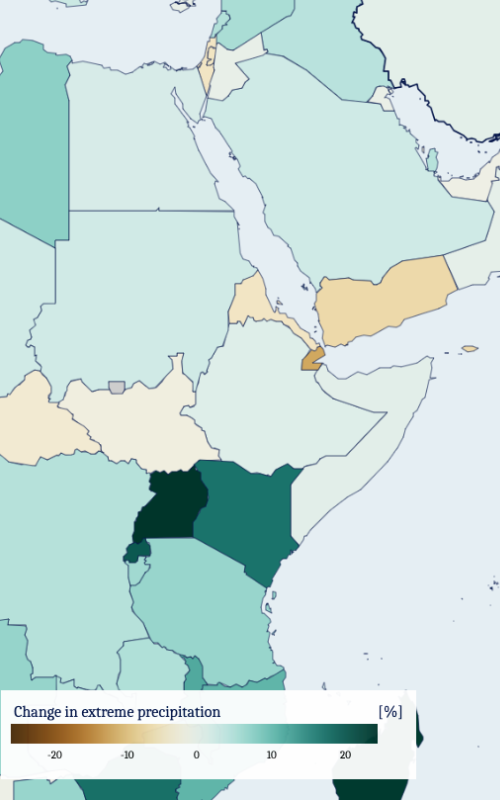
The Climate risk dashboard allows you to explore future impacts from climate change as the world warms.
Pick a geography, select one or several scenarios, and explore corresponding impacts. You can also look at how to avoid reaching undesirable climate impact levels in urban areas.
Systems Change Lab monitors, learns from and mobilises action toward the transformational shifts needed to protect both people and the planet.
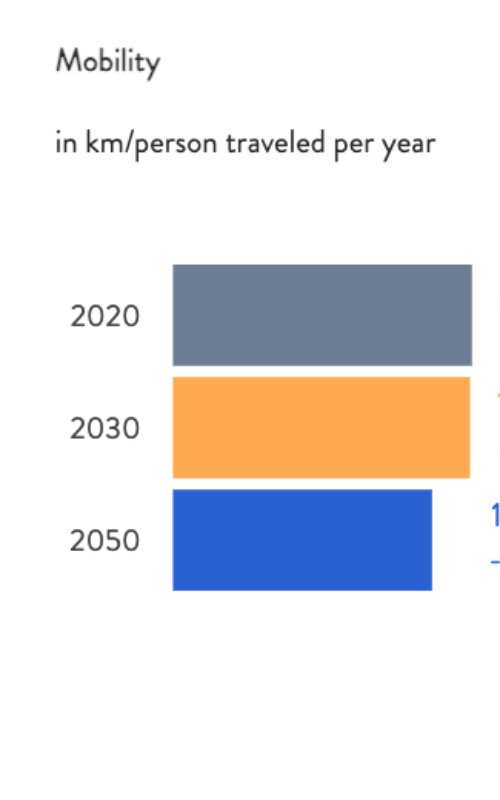
View the impact of factors such as rail transport activity, load factor of passenger cars and emissions intensity of buses on total greenhouse gas emissions from passenger transport and mobility levels for Poland, Hungary, Romania, Lithuania, and the EU-27 region.
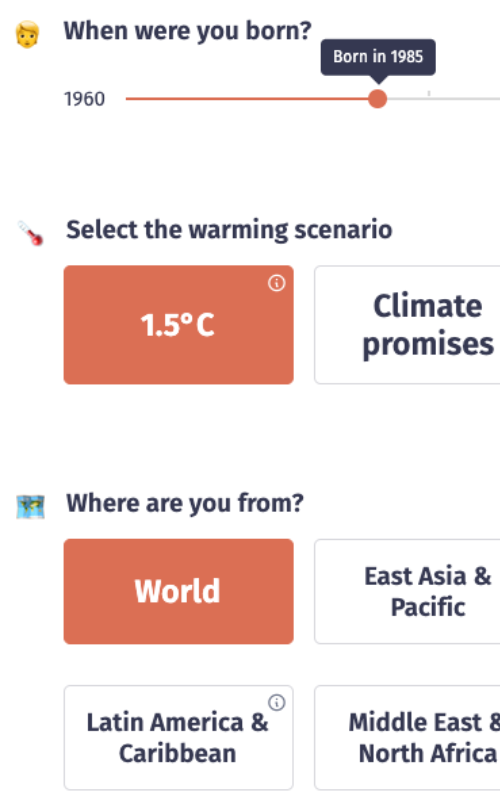
This tool offers a way to visualise how many more climate extremes you will experience in your lifetime due to climate change based on which year you were born and in which region you live.

This online tool is a resource for climate scientists which allows to relate climate impact studies to warming targets like 1.5°C and 2°C.
The current round of national emission reduction pledges (Nationally Determined Contributions/NDCs) will lead to about 3°C of warming by the end of the century. This tool shows the additional economic damages Small Island Developing States (SIDS) and Least Developed Countries (LDCs) face in a 3°C world compared with 1.5°C, the limit set out in the Paris Agreement.
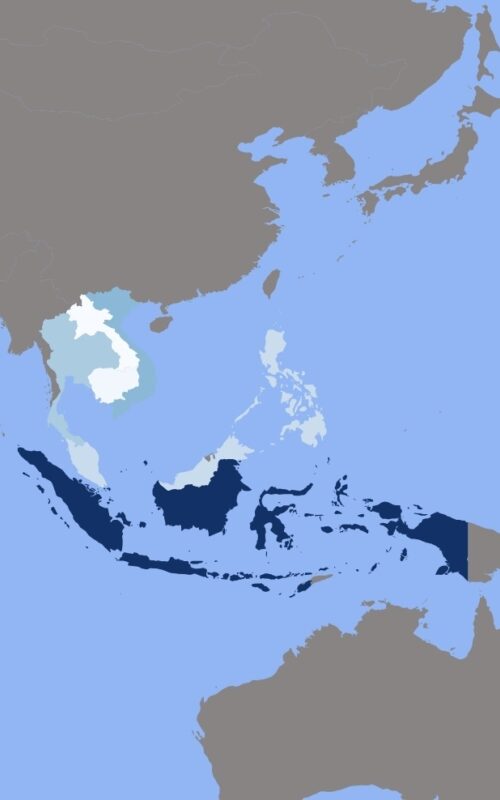
Explore how we can reduce the future human and environmental toll from climate change in different countries by limiting temperature rise to 1.5°C, compared to a 2°C rise, and a future with no increase in climate action. You can also explore a library of scientific publications on vulnerability by country.
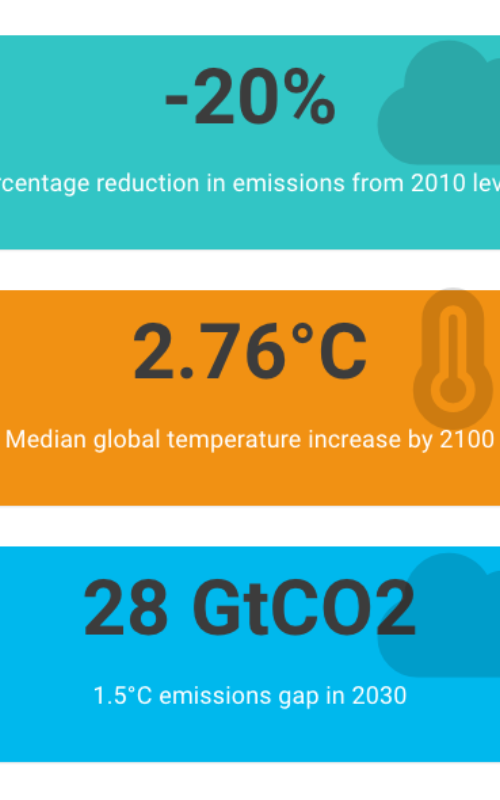
This tool allows users to visualise how changing governments' climate targets would impact warming levels and climate change risks over the 21st century.